
aws · cloudwatch · pricing
CloudWatch Pricing: Logs Cost $0.50 a GB, Metrics Cost More
By Aakash Verma ·
CloudWatch Logs costs $0.50 per GB to ingest in US East, $0.03 per GB-month to keep, and $0.005 per GB every time Logs Insights scans it. Custom metrics are $0.30 each per month for the first 10,000. Everyone looks at the log line first, and on most of the bills we read the log line isn’t the one that got out of hand.
Prices are from the CloudWatch pricing page and the AWS Price List for US East (N. Virginia), published October 7, 2026, checked October 30, 2026.
The price list, cut down to what a startup uses
| What | Price | Free each month |
|---|---|---|
| Logs ingested, Standard class | $0.50 per GB | 5 GB, shared with storage and scans |
| Logs ingested, Infrequent Access class | $0.25 per GB | same 5 GB |
| Lambda and other vended logs | $0.50 per GB for the first 10 TB, then $0.25, $0.10, $0.05 | same 5 GB |
| Log storage | $0.03 per GB-month | same 5 GB |
| Logs Insights queries | $0.005 per GB scanned | same 5 GB |
| Live Tail | $0.01 per minute | 1,800 minutes |
| Custom metrics | $0.30 each for the first 10,000, then $0.10, $0.05, $0.02 | 10 |
| Alarms | $0.10 per metric (standard), $0.30 (high resolution), $0.50 composite | 10 standard |
| API requests (PutMetricData and most others) | $0.01 per 1,000 | 1 million |
| GetMetricData | $0.01 per 1,000 metrics requested | none |
Two things in that table catch people. Storage is billed on the compressed size, so it is small next to ingestion: AWS’s own example assumes 30 GB of logs compresses to 6 GB. And since May 2025, Lambda logs are billed as vended logs with volume tiers, but the first tier is 10 TB, so for anyone reading this the price is still $0.50.
A worked bill
A hypothetical B2B SaaS on AWS: an API on ECS logging every request with its body, a few Lambda workers, and CloudWatch left at the defaults for a year.
| Line | Usage | Cost a month |
|---|---|---|
| API logs ingested | 300 GB × $0.50 | $150.00 |
| Lambda logs ingested | 100 GB × $0.50 | $50.00 |
| Log storage, retention “Never expire” | a year of logs, about 960 GB compressed × $0.03 | $28.80 |
| Logs Insights from an on-call dashboard | 3 widgets over the last 24 hours, opened about 20 times a day: 24,000 GB scanned × $0.005 | $120.00 |
| Custom metrics | 6 metrics per tenant, a tenantId dimension, 400 tenants: 2,390 billable × $0.30 | $717.00 |
| Alarms | 25, 15 billable × $0.10 | $1.50 |
| Total | $1,067.30 |
(We left out the 5 GB free log allowance. It’s worth $2.50 at most.)
The $717 line is the one nobody planned. With the Embedded Metric Format, a developer adds tenantId as a dimension because it makes a nice per-customer graph, and CloudWatch counts every unique combination of metric name and dimension values as its own metric. Six metrics times 400 tenants is 2,400 metrics. Sign up 100 more customers and the bill goes up by $180 a month without anyone touching the code.
What we’d change, biggest first
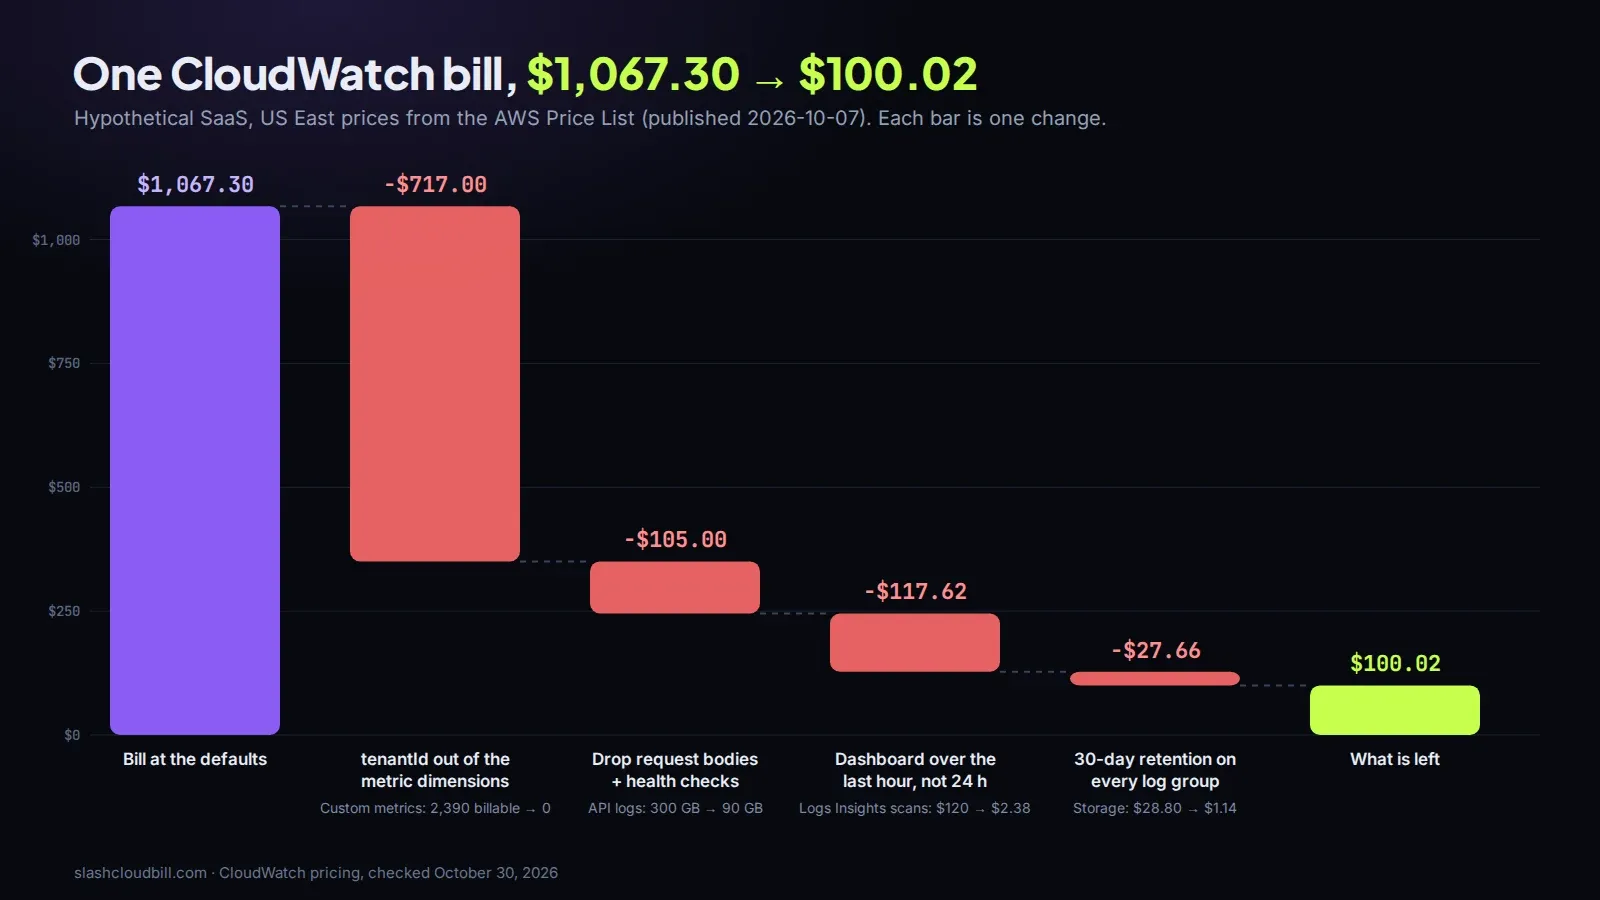
Take tenantId out of the dimensions. Keep it as a property in the log line instead. EMF writes the whole JSON object to the log, so you can still answer “which tenant is slow” with a Logs Insights query when you need it, and the six metrics without the dimension fit inside the 10 free ones. That’s the $717.
Log less from the API. Request bodies and load balancer health checks are usually most of an API’s log volume. Say dropping them takes the API from 300 GB to 90 GB: $105 a month saved, and the logs get easier to read too. Plenty of teams run at DEBUG in production because someone turned it on during an incident in March and never turned it off.
Point the dashboard at the last hour. A Logs Insights widget runs its query every time the dashboard loads or refreshes, and each run scans every GB in the time range. Last hour instead of last 24 hours, on the smaller log volume, drops that line from $120 to about $2.38. If someone needs yesterday, they can change the range for that one view.
Set a retention period. New log groups keep everything forever by default. Thirty days on all of them takes storage from $28.80 to about $1.14. It’s the smallest saving here, which surprises people, because retention is the fix every checklist starts with. It still keeps growing every month you don’t do it, so do it with the put-retention-policy command or in your infrastructure code.
After those four, the example is at $100.02 a month: $45 API logs, $50 Lambda logs, $1.14 storage, $2.38 queries, $1.50 alarms.
Infrequent Access: half price, with a list of catches
The Infrequent Access log class ingests at $0.25 per GB, half of Standard, and storage and query prices are the same. What you lose: metric filters, subscription filters, Live Tail, anomaly detection, the GetLogEvents and FilterLogEvents APIs, and Embedded Metric Format. You can still query it with Logs Insights and export it to S3.
And the class can’t be changed after the log group exists. You create a new log group and point the app at it.
We’d use it for audit trails and verbose debug output that only gets read after something went wrong. Not for the API’s main log, where people use Live Tail during deploys and alarms hang off metric filters.
Lambda has a third option: a log group in the Delivery class, which keeps the logs in CloudWatch for two days and ships them to S3 or Firehose at $0.25 per GB. No Logs Insights on those. Fine for workers whose logs you’d only read in Athena anyway.
Finding your own numbers
In Cost Explorer, filter to CloudWatch and group by usage type. The names in the AWS Price List are the ones to look for, usually with a region prefix in front: DataProcessing-Bytes is log ingestion, TimedStorage-ByteHrs is storage, DataScanned-Bytes is Logs Insights, MetricMonitorUsage is custom metrics, GMD-Metrics is GetMetricData. Then in the CloudWatch console, the log groups list has a stored bytes column you can sort by, and the metrics browser shows how many metrics each namespace holds, which is where a multiplied dimension shows up.
GetMetricData deserves a look if you run Grafana or Datadog against CloudWatch. Those tools poll it, and it has no free tier.
Founders who moved an app off a builder like Lovable onto their own AWS account (the lovable2live.com guide to that move covers the server side) often find CloudWatch on the bill for the first time, usually with every default still in place.
The CloudWatch pricing calculator prices your own volumes line by line. If CloudWatch is one line on a bigger AWS bill, our free cloud cost audit ($0) reads the whole thing, and we cut startup AWS bills for $0 up front, paid from 50% of the verified saving for 6 months. The NAT gateway side of the same bill is in AWS NAT gateway cost.
Want us to look at your bill?
No upfront fee: for six months you pay half of what we save you each month, then you keep all of it. Nothing saved, nothing owed.
Also here: Free cloud cost audit ($0) · Cloud cost optimization services: $0 up front · Reduce your startup's AWS bill · Pricing: paid only from verified savings · Move from AWS to a European cloud